Her er resultatet av våre kunders ønsker!
Et bærbart akustisk kamera med lav vekt, god oppløsning og mulighet til også å måle og analysere lave frekvenser.
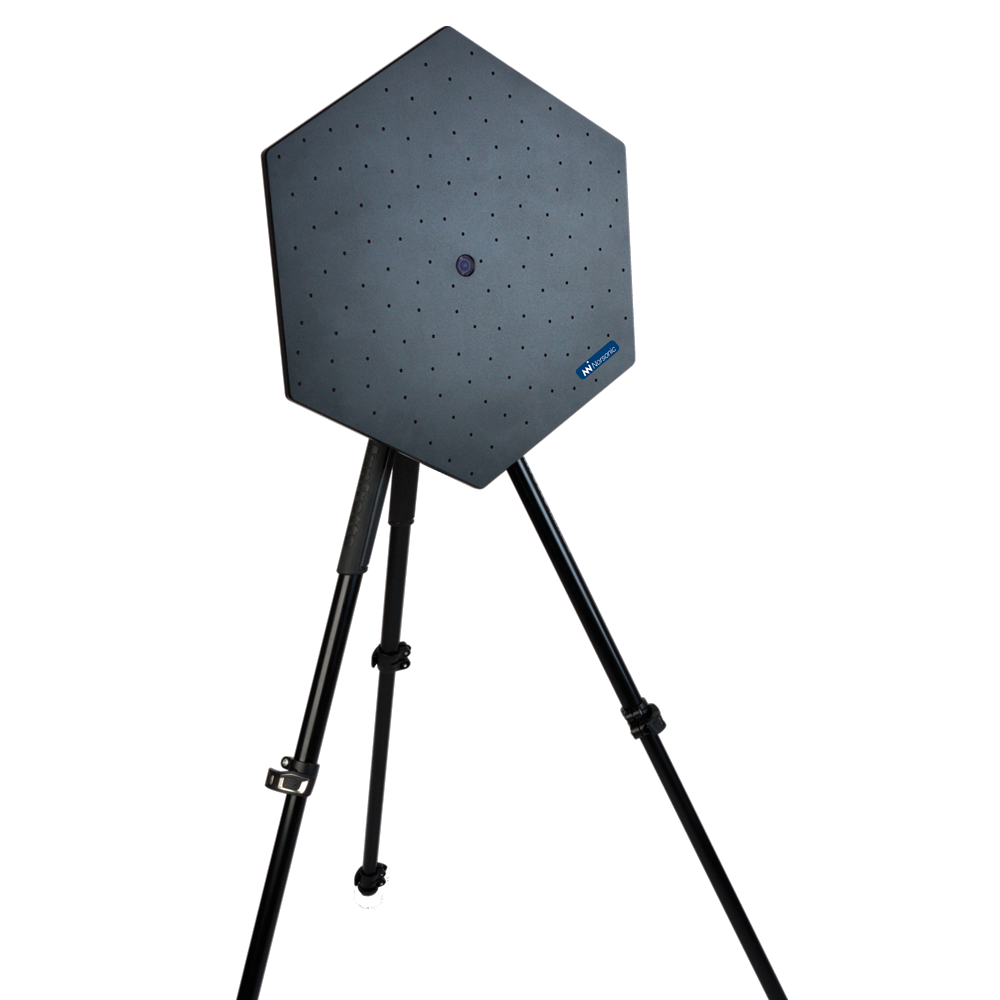
Hextile – Lett og bærbar
128 mikrofoner – 46 cm.
Med en Hextile har brukeren et lite, bærbart og lett akustisk kamera som kan brukes til et bredt spekter av målesituasjoner. Systemet kan monteres på stativ eller brukes håndholdt.
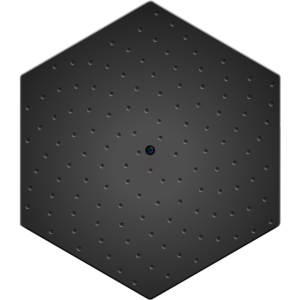
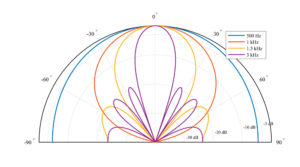
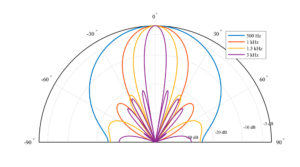
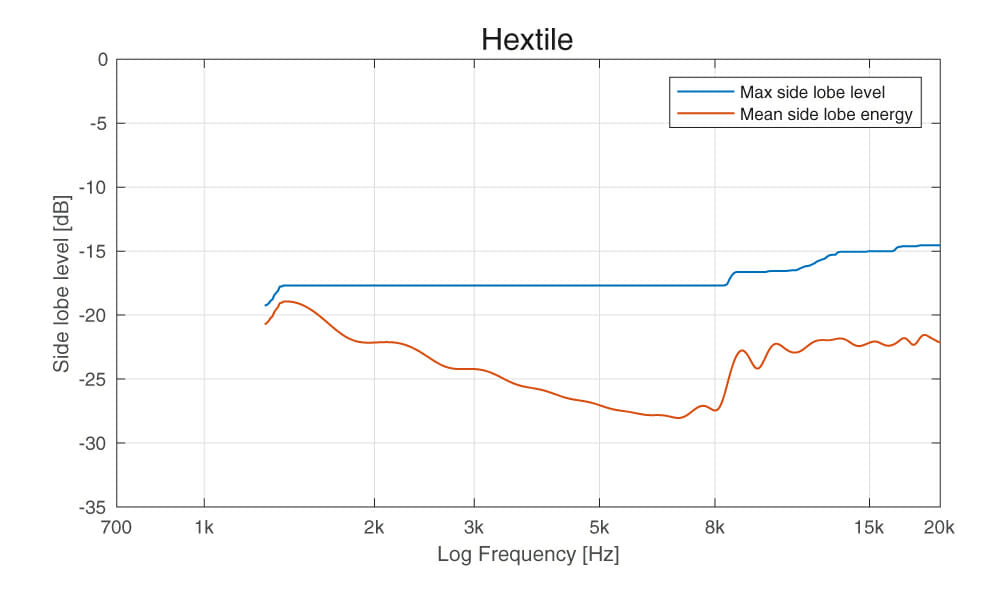
Array geometry and beampattern for Hextile
Multitile – God oppløsning!
384 mikrofoner – 96 cm.
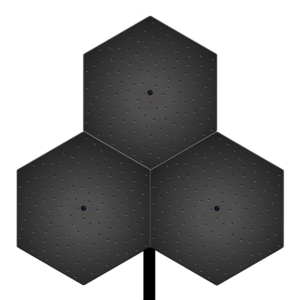
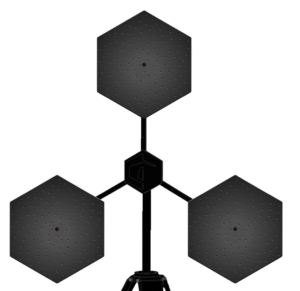
For brukere som ønsker optimal oppløsning for å kunne analysere flere lydkilder parallelt i et bredt frekvensområde, kan tre hextiles enkelt kombineres til et kraftig multitile akustisk kamera.
Multitile – great resolution
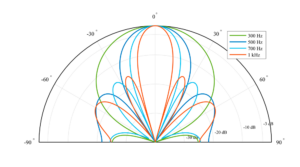
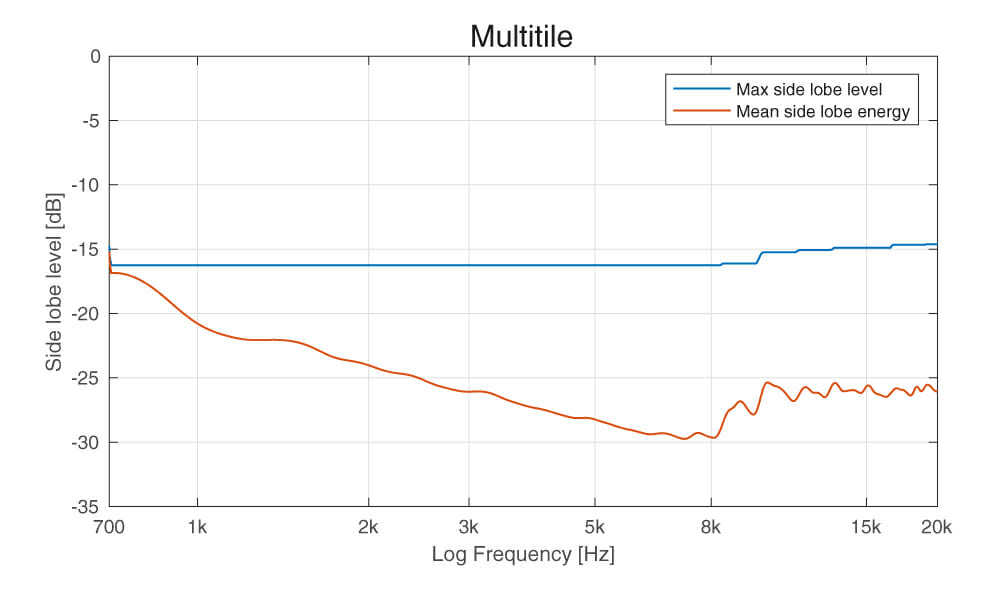
Array geometry and beampattern for Multitile
Multitile (LF mode) – lave frekvenser
384 mikrofoner – 146 cm.
Ved å plassere tre Hextiles lenger fra hverandre, økes den maksimale diameteren til hele systemet, noe som gjør det ideelt for måling av lavfrekvente lydkilder – Genialt!
Multitile (LF mode) – Low frequency measurements
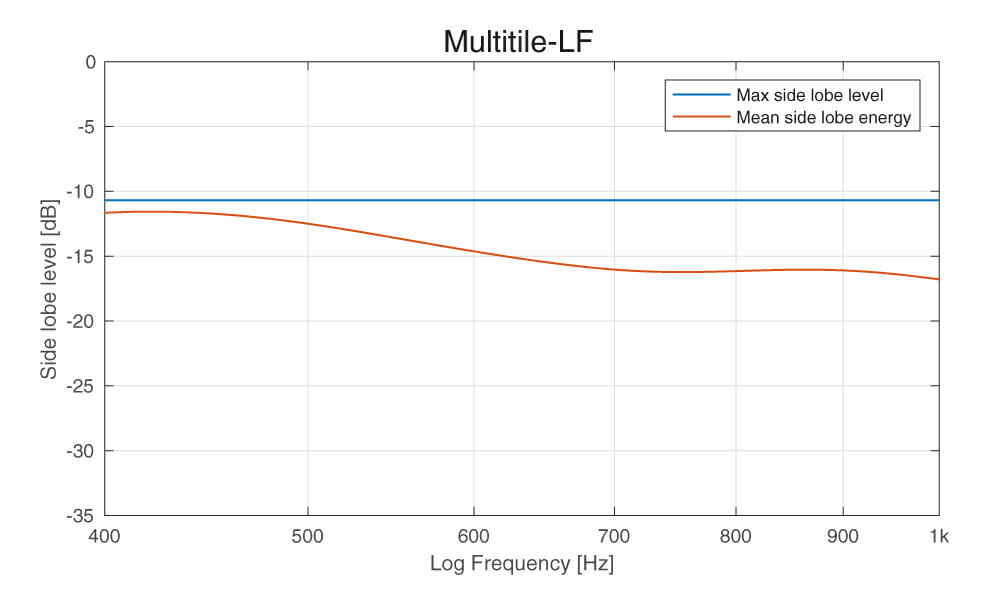
Array geometry and beampattern for Multitile (LF mode)
Software design
text
The software design strategy has always had user friendliness and ease of use in mind. We want the user to be able to get results quickly, and start analysing recordings easily, thus spending time on the analysis, rather than the measurement set up or configuration of parameters. Live view of measurements combined with an intuitive software interface enables users without prior experience to make measurements within the first five minutes after powering the device.
Virtual microphone
text
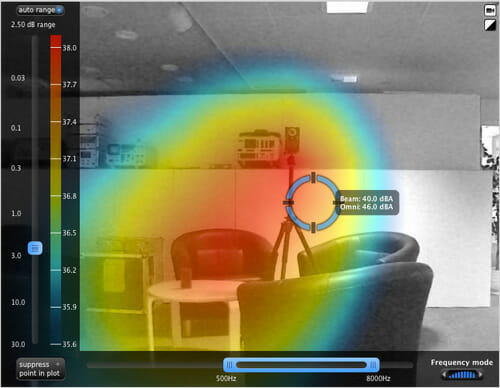
The one feature that really sets the software apart is the virtual microphone. The virtual microphone enables the capability to only get audio signals from the chosen listening point, and listen to sounds coming from specific directions of the video image, while suppressing noise and sounds emitting from other positions than what is selected. With this tool the user has the power of super hearing, and may gain more insight in addition to regular colour plotting of sources. Such super hearing may be especially useful in noisy and complex sound environments, where for instance different noise sources greatly impair the ability to distinguish which machinery is producing a faulty noise.
Advanced post-processing audio analysis
text
In addition to live plotting and directive listening, it is also possible to record measurements and do the analysis at a later time. The raw signal from all microphones are then saved, and all parameters such as frequency selection, time selection and so on can be changed in post-processing. This means that a recording can be done without selecting the optimal parameters during the measurement, since these can be changed when analysing the recording. This also means that anybody can do the actual recordings themselves since it is then basically a matter of pointing the array roughly towards the area of interest and pressing record. All analysis and changes of parameters can be done in post-processing such as directive listening, graphical overlay of sources, spectrogram, FFT analysis and so on.
Acoustic eraser
text
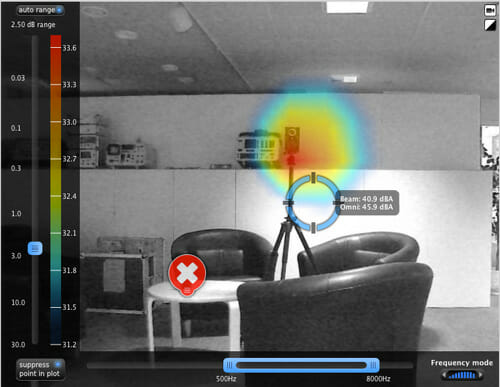
Sometimes sources may be closely spaced apart, or a strong noise source in the area of interest is interfering with the recording and impairing the image quality. Often this will be seen as either a single large source, or the source of interest will be completely shadowed by the stronger source. Seen in the image below is a situation where two equally strong sources are positioned close to one another, and the resulting colour plot will display a single large source. In such situations the acoustic eraser feature may prove valuable. This function will add a red circle to the screen that can be dragged to any point, and remove the source from that point. This is highly effective when several noise sources are present. As seen on the pictures the acoustic eraser completely removes the source where the suppress point button is positioned. The virtual microphone can further be positioned on the source of interest.
Acoustic camera acoustic eraser
Order analysis
text
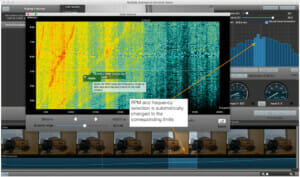
Especially in automotive applications RPM measurements may give vital information. The acoustic camera software has the possibility to display frequency content as a function of RPM by using the order analysis function.
In the spectrogram window, frequency as a function of RPM is plotted. It is further possible to select a square in the spectrogram window to isolate interesting events. By pressing the “apply” button on the selection, the RPM and frequency limits in the main view window automatically change to the limits set by the selection in the spectrogram. The user may then find and interesting sound event in the spectrogram, and automatically get the corresponding colour plotting of the event chosen.
Acoustic camera rpm
Array specifications
text
Audio and video
text
Connection:USB Microphones: 128 MEMS microphones Max sound level: 120 dB Min sound level (system): 9 dBA SNR per microphone: 65 dBA SNR array (system):82 dBA Audio sampling rate: 44.1 kHz Camera resolution: 2592 x 1944 Opening angle: 105° Frame rate:15 FPS Operating temperature range: -40 to +85
Dimension Hextile: 41 cm x 48 cm, Ø 48 cm Dimension Multitile:83 cm x 84 cm, Ø 96 cm Dimension Multitile (LF mode): 126 cm x 121 cm, Ø 146 cm Weight Hextile: < 3 kg Weight Multitile: < 10 kg Material:Aluminium Power consumption:< 3 W
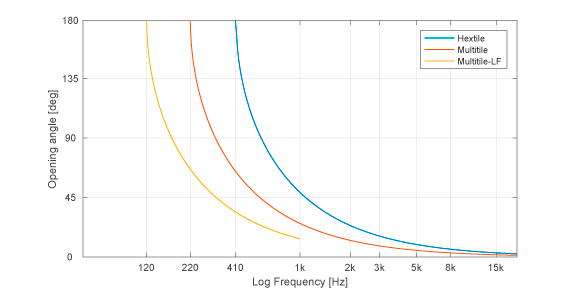
Half power beamwidth (HPBW)
text
Max side lobe level, and mean side lobe energy
text
Low frequency performance at 500 Hz
text
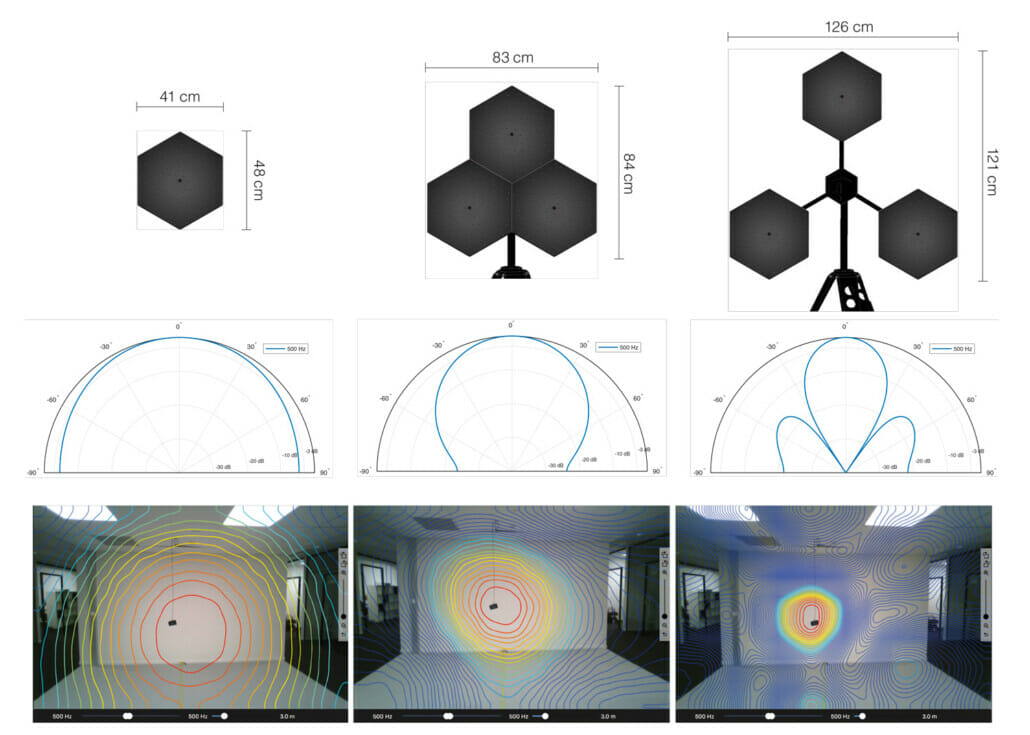
The biggest improvement when going from a single Hextile to the two different Multitile configurations is best demonstrated on a low frequency source. Seen below are the results from recordings on a single omnidirectional noise source emitting pink noise, with the colour plotting being done when the input signals are filtered at 500 Hz. This should give a direct comparison of the low frequency capability of the different arrays.
At the top are the different array configurations used for the recordings, with a 128 element Hextile, a 384 element Multitile, and a 384 element Multitile (LF mode). The diameters of the array configurations are 46 cm, 96 cm, and 1.46 m respectively.
The second rows show the beampattern for the different array configurations at 500 Hz and 3 dB dynamic range. As can be seen the beampattern gets more narrow, thus giving better resolution, as the overall array size increases.
Lastly the plotting results from the three different array configurations recorded on a real noise source are shown with 3 dB dynamic. The improvement in terms of resolution and pin-pointing the source is clearly visible when using bigger equipment.
Array geometry, beampattern at 500 HZ, and plotting results of pink noise source for Hextile, Multitile and Multitile (LF mode)